Silver Buy Idea

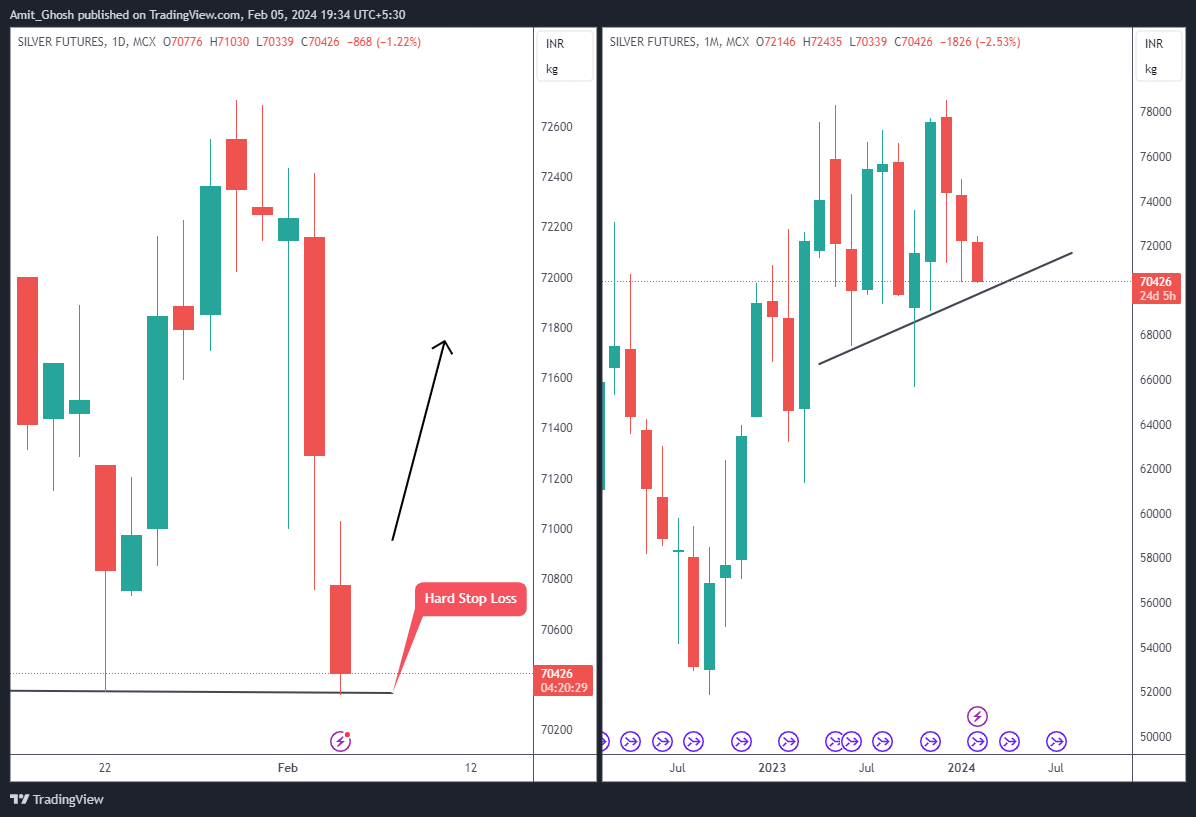
We are recommending a buy based on the following observations from the provided chart of Silver Futures:

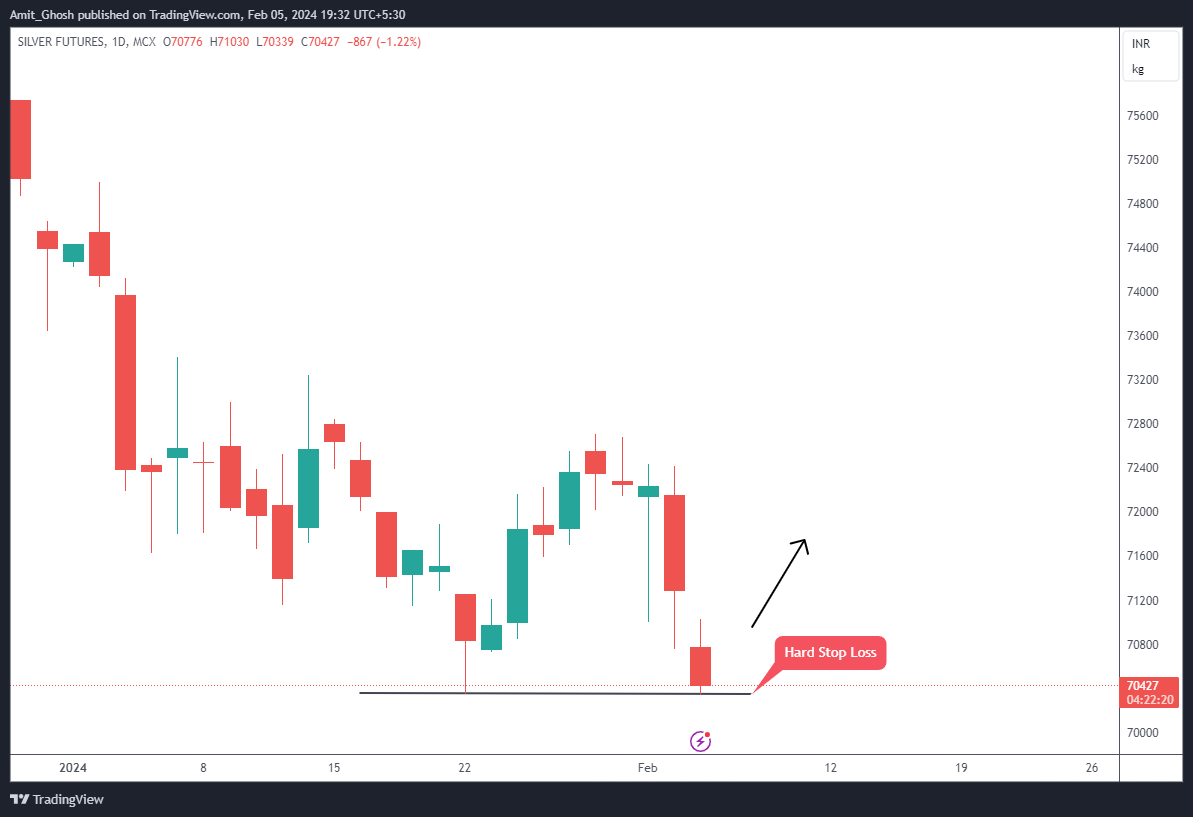
  1. Bullish Reversal Pattern: The latest candlestick on the chart appears to be forming a bullish hammer, which typically indicates a reversal of the recent downtrend. This is characterized by a small real body at the top with a long lower shadow and no upper shadow, suggesting that selling pressure was overcome by buying pressure by the end of the trading session.
  2. Support Level: The price seems to be bouncing off a support level, as indicated by the “Hard Stop Loss” label. This level, where the price has historically faced buying interest preventing further decline, is holding, which could be a sign that the market is not willing to sell below this point.
  3. Risk Management: The placement of the hard stop loss suggests a clear risk management strategy is in place. This allows for limiting potential losses if the market does not move as anticipated, which is a prudent approach to trading.
  4. Oversold Condition: The recent sharp decline may have been too fast and too severe, potentially leading to an oversold condition where the price could revert to mean, offering a buying opportunity.

Bullet Points:

  • A potential bullish hammer candlestick pattern suggests a reversal.
  • The bounce from the support level indicates underlying buying interest.
  • A set hard stop loss provides a clear risk management strategy.
  • The price action may indicate an oversold condition ripe for correction.

  1. Dual Time Frame Confluence: The daily chart (left) is showing a potential bullish reversal pattern, while the monthly chart (right) indicates a consistent uptrend with higher lows, evidenced by the ascending trendline. This confluence of bullish signals in multiple time frames often strengthens the case for an upward price movement.
  2. Trendline Support on Monthly Chart: The ascending trendline on the monthly chart has been acting as a dynamic support, with the price touching and rebounding from this line multiple times. The proximity of the current price to this trendline suggests another potential touch-and-go scenario, implying a buy opportunity.
  3. Price Action on Daily Chart: On the daily chart, after a period of decline, the price is stabilizing above the hard stop loss level, indicating that the price is not breaking below significant past support levels. The latest candlesticks seem to be smaller in range, which can often precede a change in the short-term trend.
  4. Risk Management Strategy: The use of a hard stop loss on the daily chart allows for clear risk management, protecting against unforeseen drops below the support level.

Bullet Points:

  • Confluence of bullish signals from daily and monthly time frames.
  • Monthly chart shows an established uptrend with a supporting ascending trendline.
  • Daily price action is showing stabilization, hinting at a possible reversal.
  • A defined hard stop loss provides a disciplined risk management approach.