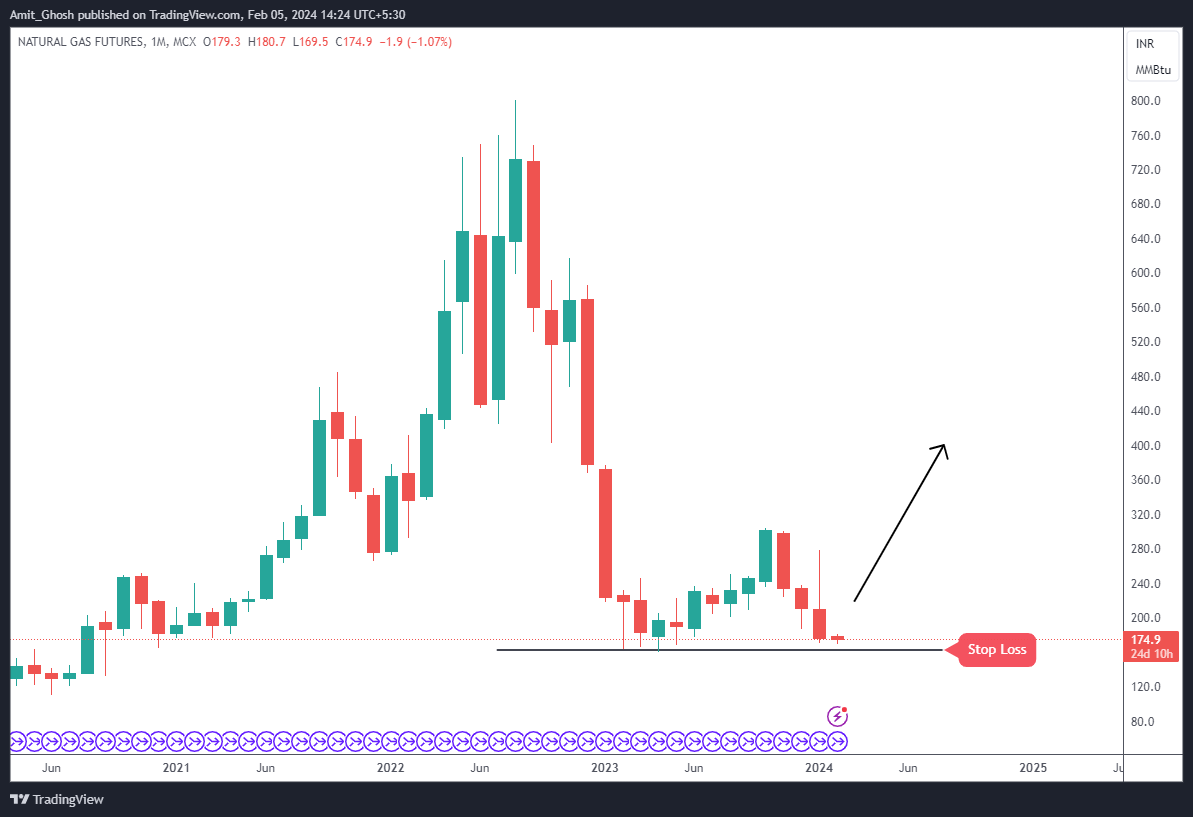
Based on the above monthly chart of Natural Gas Futures, here is a comprehensive analysis:
Bullish Indicators:
- Support Level: The chart shows a clear support level around the 170-175 INR zone, which the price has tested multiple times without breaking through. This could be indicative of a strong demand at this price level, providing a floor for the price.
- Consolidation: Prior to the point where the chart indicates a buy signal, the price action has been consolidating, which might be seen as accumulation in market terms.
- Volume: While the volume indicator is not visible, a higher volume associated with the stabilization of prices would support a bullish outlook.
Bearish Indicators:
- Downtrend: The overall trend in the past year has been bearish, with a series of lower highs. This downtrend could potentially continue unless a strong reversal pattern is confirmed.
- Red Candles: The presence of red candles indicates that there have been significant selling pressures in the recent months.
Analysis Summary:
- The recommendation to buy could be based on the expectation that the support level will hold, leading to a potential trend reversal.
- The projected upward arrow signifies an anticipation of a bullish trend in the upcoming months.
- The stop loss suggests a risk management strategy, ensuring that losses are contained should the price break below the support level and the trade doesn’t go as expected.
Trading Strategy:
- Entry Point: One could consider entering a long position near the support level, as it has been tested multiple times, showing strength.
- Stop Loss: Setting a stop loss slightly below the support level to minimize potential losses if the support fails.
- Profit Targets: Should be set considering previous resistance levels or significant price levels identified from past price actions.
Risk Management:
- It’s crucial to consider the position size relative to the risk tolerance of the portfolio.
- The risk-reward ratio should be evaluated before entering the trade to ensure it aligns with the overall trading strategy.
Conclusion: This chart suggests a potential buy opportunity based on technical support levels. However, considering the prevailing downtrend, traders should proceed with caution and employ strict risk management practices. It’s important to monitor closely for any signs of bearish continuation or bullish reversal patterns to reassess the position.
Bullet Points:
- Support at 170-175 INR zone suggests strong demand.
- Consolidation pattern may indicate accumulation.
- The overall downtrend and presence of red candles highlight existing selling pressures.
- Buy recommendation based on support holding and anticipated trend reversal.
- Stop loss provides a risk management measure below the support level.
- Entry point near support level, with profit targets set at historical resistance levels.
- Risk management is crucial; position size and risk-reward ratio must be evaluated.
- Vigilant monitoring required for trend confirmation.